Dermapharm Share
Stock information
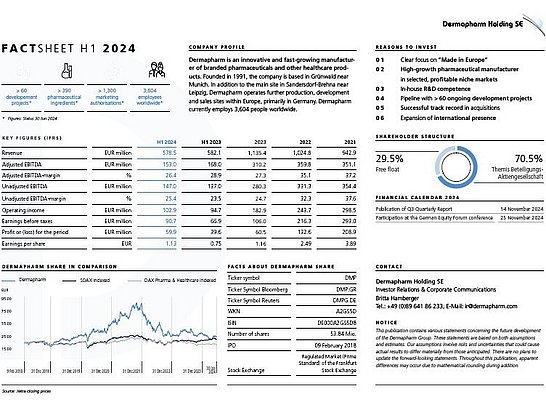
| ISIN / WKN | DE000A2GS5D8 / A2GS5D |
| Stock exchange symbol / Reuters symbol | DMP |
| Type of Shares | bearer shares with no par value (Stückaktien) |
| First day of tradin | 9 February 2018 |
| Number of Shares | 53.84 million |
| Stock Exchanges | Regulated Market (Prime Standard) of the Frankfurt Stock Exchange |
| Index | SDAX since 23th September 2019 |
| Analysts |
Harald Hof, mwb research Gerhard Orgonas, Berenberg Fabian Piasta, Jefferies Marietta Miemietz, Pareto Securities Stephan Wulf, ODDO BHF |
| Designated Sponsors | Stifel |
| Paying Agent | Quirin Bank |
Financial Figures
2023
| 2023 | ||
| Revenue | EUR million | 1,135.4 |
| Adjusted EBITDA | EUR million | 310.2 |
| Adjusted EBITDA Margin | % | 27.3 |
| Unadjusted EBITDA | EUR million | 280.3 |
| Unadjusted EBITDA Margin | % | 24.7 |
| Operating Income | EUR million | 182.9 |
| EBT | EUR million | 106.0 |
| Profit (or loss) for the period | EUR million | 60.5 |
| Earnings per share | EUR | 1.16 |
| Dividend | EUR | 0.88 |
| Balance sheet | EUR million | 2,160.7 |
| Equity | EUR million | 545.0 |
| Equity ratio | % | 25.2 |
| Cash and cash equivalents | EUR million | 158.7 |
| Net debt | EUR million | 936.6 |
2022
| 2022 | ||
| Revenue | EUR million | 1.024,8 |
| Adjusted EBITDA | EUR million | 359,8 |
| Adjusted EBITDA Margin | % | 35,1 |
| Unadjusted EBITDA | EUR million | 331,3 |
| Unadjusted EBITDA Margin | % | 32,3 |
| Operating income | EUR million | 243,7 |
| EBT | EUR million | 216,3 |
| Profit or (loss) for the period | EUR million | 132,6 |
| Earnings per share | EUR | 2,49 |
| Dividend | EUR | 1,05 |
| Balance sheet | EUR million | 1.412,8 |
| Equity | EUR million | 532,5 |
| Equity ratio | % | 37,7 |
| Cash and cash equivalents | EUR million | 151,0 |
| Net debt | EUR million | 367,8 |
2021
| Revenue | EUR million | 942.9 |
| Adjusted EBITDA | EUR million | 351.1 |
| Adjusted EBITDA Margin | % | 37.2 |
| Unadjusted EBITDA | EUR million | 354.4 |
| Unadjusted EBITDA Margin | % | 37.6 |
| Operating income | EUR million | 298.5 |
| EBT | EUR million | 293.0 |
| Profit or (loss) for the period | EUR million | 208.9 |
| Earnings per share | EUR | 3.89 |
| Dividend | EUR | 2.17 |
| Balance sheet | EUR million | 1,407.0 |
| Equity | EUR million | 499.8 |
| Equity ratio | % | 35.5 |
| Cash and cash equivalents | EUR million | 161.4 |
| Net debt | EUR million | 419.7 |
2020
| Revenue | EUR million | 793.8 |
| Adjusted EBITDA | EUR million | 200.7 |
| Adjusted EBITDA Margin | % | 25.3 |
| Unadjusted EBITDA | EUR million | 184.5 |
| Unadjusted EBITDA Margin | % | 23.2 |
| Operating income | EUR million | 136.9 |
| EBT | EUR million | 125.3 |
| Profit or (loss) for the period | EUR million | 85.9 |
| Earnings per share | EUR | 1.59 |
| Dividend | EUR | 0.88 |
| Balance sheet | EUR million | 1,224.40 |
| Equity | EUR million | 324.6 |
| Equity ratio | % | 26.5 |
| Cash and cash equivalents | EUR million | 120.3 |
| Net debt | EUR million | 486.8 |
2019
| Revenue | EUR million | 700.9 |
| Adjusted EBITDA | EUR million | 177.6 |
| Adjusted EBITDA Margin | % | 25.3 |
| Unadjusted EBITDA | EUR million | 168.8 |
| Unadjusted EBITDA Margin | % | 24 |
| Operating income | EUR million | 119.5 |
| EBT | EUR million | 110.1 |
| Profit or (loss) for the period | EUR million | 77.8 |
| Earnings per share | EUR | 1.43 |
| Dividend | EUR | 0.8 |
| Balance sheet | EUR million | 1,044.90 |
| Equity | EUR million | 284.5 |
| Equity ratio | % | 27.2 |
| Cash and cash equivalents | EUR million | 115 |
| Net debt | EUR million | 465.4 |
2018
| Revenue | EUR million | 572.4 |
| Adjusted EBITDA | EUR million | 143.4 |
| Adjusted EBITDA Margin | % | 25.1 |
| Unadjusted EBITDA | EUR million | 139.6 |
| Unadjusted EBITDA Margin | % | 24.4 |
| Operating income | EUR million | 107.5 |
| EBT | EUR million | 104.2 |
| Profit or (loss) for the period | EUR million | 75.2 |
| Earnings per share | EUR | 1.41 |
| Dividend | EUR | 0.77 |
| Balance sheet | EUR million | 704.6 |
| Equity | EUR million | 256.1 |
| Equity ratio | % | 36.3 |
| Cash and cash equivalents | EUR million | 212.5 |
| Net debt | EUR million | 95.2 |
2017
| Revenue | EUR million | 467.1 |
| Adjusted EBITDA | EUR million | 112.9 |
| Adjusted EBITDA Margin | % | 24.2 |
| Unadjusted EBITDA | EUR million | 110.2 |
| Unadjusted EBITDA Margin | % | 23.6 |
| Operating income | EUR million | 92.1 |
| EBT | EUR million | 88 |
| Profit or (loss) for the period | EUR million | 77.7 |
| Earnings per share | EUR | 1.56 |
| Dividend | EUR | - |
| Balance sheet | EUR million | 415.3 |
| Equity | EUR million | 73.7 |
| Equity ratio | % | 17.7 |
| Cash and cash equivalents | EUR million | 6.3 |
| Net debt | EUR million | 258.5 |
2016
| Revenue | EUR million | 444.5 |
| Adjusted EBITDA | EUR million | 102.7 |
| Adjusted EBITDA Margin | % | 23.1 |
| Unadjusted EBITDA | EUR million | 102.7 |
| Unadjusted EBITDA Margin | % | 23.1 |
| Operating income | EUR million | 86.8 |
| EBT | EUR million | 82.9 |
| Profit or (loss) for the period | EUR million | 77 |
| Earnings per share | EUR | 1.54 |
| Dividend | EUR | - |
| Balance sheet | EUR million | 311.7 |
| Equity | EUR million | 60.8 |
| Equity ratio | % | 19.5 |
| Cash and cash equivalents | EUR million | 3.8 |
| Net debt | EUR million | 173.7 |
2015
| Revenue | EUR million | 384.8 |
| Adjusted EBITDA | EUR million | - |
| Adjusted EBITDA Margin | % | - |
| Unadjusted EBITDA | EUR million | 84.7 |
| Unadjusted EBITDA Margin | % | 22 |
| Operating income | EUR million | 43.3 |
| EBT | EUR million | 55.3 |
| Profit or (loss) for the period | EUR million | 52.4 |
| Earnings per share | EUR | - |
| Dividend | EUR | - |
| Balance sheet | EUR million | 296.7 |
| Equity | EUR million | 44.4 |
| Equity ratio | % | 15 |
| Cash and cash equivalents | EUR million | 2.8 |
| Net debt | EUR million | 189.7 |
2014
| Revenue | EUR million | 391.3 |
| Adjusted EBITDA | EUR million | - |
| Adjusted EBITDA Margin | % | - |
| Unadjusted EBITDA | EUR million | 72.4 |
| Unadjusted EBITDA Margin | % | 18.5 |
| Operating income | EUR million | 60.8 |
| EBT | EUR million | 35.5 |
| Profit or (loss) for the period | EUR million | 33.2 |
| Earnings per share | EUR | - |
| Dividend | EUR | - |
| Balance sheet | EUR million | 330.6 |
| Equity | EUR million | 34 |
| Equity ratio | % | 10.3 |
| Cash and cash equivalents | EUR million | 11.6 |
| Net debt | EUR million | 210.8 |
Financial Calendar
Upcoming dates
Financial Reports & Presentations
Some presentations are password protected. If you are interested, please contact ir@dermapharm.com.
2024
Presentations
Financial Reports
2023
Presentations
Financial Reports
2022
Financial Reports
Presentations
Capital Markets Day
2021
Financial Reports
Presentations
2020
Financial Reports
Presentations
2019
Financial Reports
Presentations
2018
Financial Reports
Presentations
2017
Financial Reports
2016
Financial Reports
Corporate Governance
Voting Rights Announcement
Notifications relating to holding of voting rights according to Sect. 33 ff. WpHG are to be sent via e-mail to ir@dermapharm.com.
2023-07-06 | VOTING RIGHTS ANNOUNCEMENT OF MAWER GLOBAL SMALL CAP FUND
2023-05-31 | VOTING RIGHTS ANNOUNCEMENT OF MAWER INVESTMENT MANAGEMENT LTD
2020-10-15 | VOTING RIGHTS ANNOUNCEMENT OF WILHELM BEIER
Declaration of conformity
Directors´ Dealings
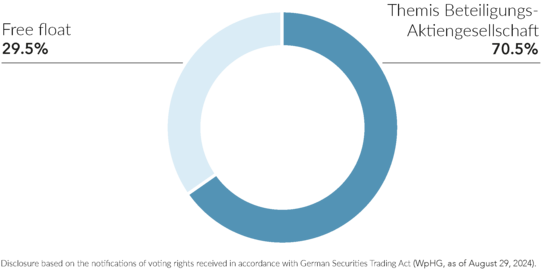
2024-08-29 I ANNOUNCEMENT OF THEMIS BETEILIGUNGS-AKTIENGESELLSCHAFT
2024-06-11 I ANNOUNCEMENT OF SUSANNE GERTRUD PIA LANZ
2024-05-16 I ANNOUNCEMENT OF THEMIS BETEILIGUNGS-AKTIENGESELLSCHAFT
2024-03-28 I ANNOUNCEMENT OF ANJA SCHORN
2024-04-05 I ANNOUNCEMENT OF WILHELM BEIER
2023-11-23 I ANNOUNCEMENT OF THEMIS BETEILIGUNGS-AKTIENGESELLSCHAFT
2023-04-03 | ANNOUNCEMENT OF CHRISTOF DREIBHOLZ
2023-01-11 | ANNOUNCEMENT OF CHRISTOF DREIBHOLZ
2022-10-14 | ANNOUNCEMENT OF DR HANS-GEORG FELDMEIER
2022-10-13 | ANNOUNCEMENT OF THEMIS BETEILIGUNGS-AKTIENGESELLSCHAFT
2020-07-22 | ANNOUNCEMENT OF HILDE NEUMEYER
2020-02-02 | ANNOUNCEMENT OF HILDE NEUMEYER
2020-11-18 | ANNOUNCEMENT OF HILDE NEUMEYER
2020-10-15 | ANNOUNCEMENT OF THEMIS BETEILIGUNGS-AKTIENGESELLSCHAFT
2020-10-14 | ANNOUNCEMENT OF HILDE NEUMEYER
2019-08-08 | ANNOUNCEMENT OF KARIN SAMUSCH
2019-07-01 | ANNOUNCEMENT OF THEMIS BETEILIGUNGS-AKTIENGESELLSCHAFT
2018-03-13 | ANNOUNCEMENT OF THEMIS BETEILIGUNGS-AKTIENGESELLSCHAFT
2018-02-09 | ANNOUNCEMENT OF THEMIS BETEILIGUNGS-AKTIENGESELLSCHAFT
2018-02-09 | ANNOUNCEMENT OF THEMIS BETEILIGUNGS-AKTIENGESELLSCHAFT
Compliance
Other documents
Annual general meeting
Annual General Meeting 2024
Documents
Annual General Meeting 2023
Documents
Annual General Meeting 2022
Documents
Annual General Meeting 2021
Documents
Annual General Meeting 2020
Documents
Annual General Meeting 2019
Documents
Annual General Meeting 2018
Documents
Sustainability
Consistent growth strategy
In-house product development
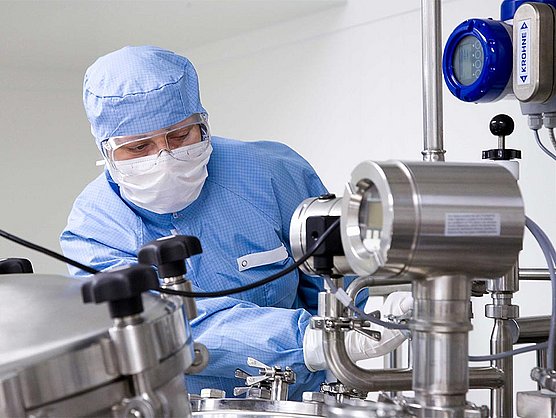
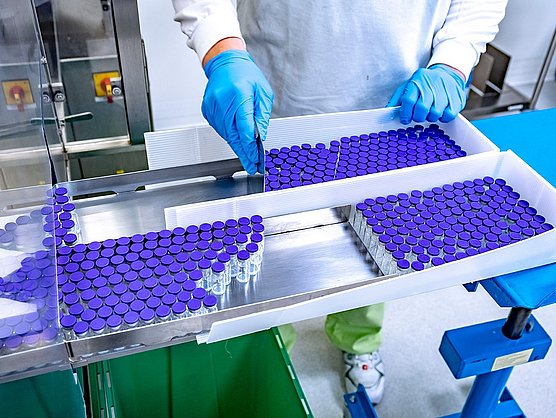
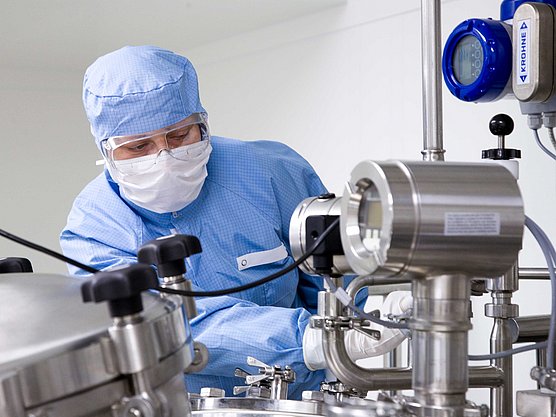
The Dermapharm Group develops pharmaceuticals and other healthcare products in its core therapeutic areas at four corporate locations, where experienced experts conduct development and authorisation activities – including designing and funding clinical trials. Once authorisation is granted, newly developed products are generally put into production in-house. In total, the Group manufactures about 90% of the pharmaceutical product portfolio itself.
The focal points of the development work are:
- Expanding the portfolio of off-patent branded pharmaceuticals in dermatology
- Further developing allergy therapy product range
- Developing science-based food supplements
- Developing new phytoextracts
- Further developing the range of medical devices

Internationalisation

The Dermapharm Group has been operating in Austria, Switzerland, Croatia, Poland and Ukraine for many years now. In order to further expand its business with branded pharmaceuticals and other healthcare products, the Group has formed subsidiaries in Italy and Spain. Country-specific portfolios are formed/developed based in each case on a detailed analysis of market conditions, with compounds developed and manufactured by the Group in particular receiving marketing authorisation. This enables the Group to gradually enlarge its portfolio and the respective sales and distribution structures as it expands into new markets. For instance, the Dermapharm Group is expanding into other countries in Europe, Asia and the Americas with its CE-certified and internationally patented medical devices bite away® and Herpotherm®.
Another key aspect of the Group's internationalisation efforts is the acquisition of companies with international operations. With the acquisition of Euromed, Dermapharm is represented with herbal extracts in Spain. Allergopharma and Cernelle also contribute to further internationalisation. Most recently, the Dermapharm Group gained market access to Western and Southern Europe with the acquisition of Arkopharma.
M&A activities
Acquiring individual products, portfolios and companies has always been part of Dermapharm's business strategy and a key success factor for its continued growth. Since its formation in 1991, the Group has steadily expanded its product offering through successful acquisitions in Germany and abroad. This includes, for instance, the acquisition of attractive patented medical devices and pharmaceutical manufacturers, which complement the Group's portfolio ideally and expand its offering in growth markets. Another aim when making these types of acquisitions is to further increase the potential of the newly acquired companies by optimising processes and incorporating the companies in the Group's production and logistics structures. The Dermapharm Group continually reviews specific growth opportunities and pursues promising acquisition options that fit its strategic alignment.

Newsletter
We will be happy to include you in our news service!
Please fill out the form and you will receive information on investor relations topics.
Contact information investor relations
If you have any further questions, you can contact us at any time. For this purpose, you can contact us in writing via e-mail or directly by telephone. In addition, we offer you the option of subscribing to our IR news service to receive information from Dermapharm Holding SE in a timely manner. You can also find all current dates in the financial calendar.

Britta Hamberger
Head of Investor Relations
& Corporate Communications
Phone: +49 89 641 86 233
britta.hamberger@dermapharm.com
Dermapharm Holding SE
Lil-Dagover-Ring 7
82031 Grünwald
Germany

